HIGHER EDUCATION Case study
Leveraging data for a dynamic master plan
This higher education institution had spent countless hours creating an academic and workforce strategic plan; they needed to understand how their multiple campuses could support those initiatives through a comprehensive master plan. They wanted a complete understanding of the current state, along with a roadmap to address academic program needs and provide critical information for capital planning efforts.
Human Ecology issue
This higher education institution had spent countless hours creating an academic and workforce strategic plan; they needed to understand how their multiple campuses could support those initiatives through a comprehensive master plan. They wanted a complete understanding of the current state and a roadmap to meeting academic program needs as well as critical information for capital planning efforts.
Key insights
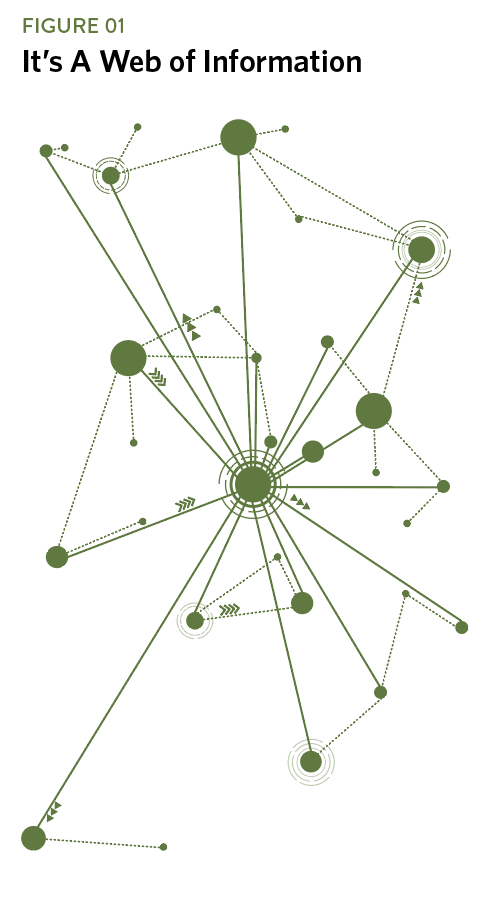
Let’s play a game of telephone…with data:
DORIS found the organization had massive amounts of data, and they were all collected, stored, and analyzed in different (and incompatible) ways which led to difficulty connecting the data sources and displaying the data in a manner that supports decision-making.
Think of it as a game of telephone, but instead of information traveling from a single point, it originates from multiple sources and is, at times, multiplied by 19. The figure illustrates what this looks like.
A paradox of perception
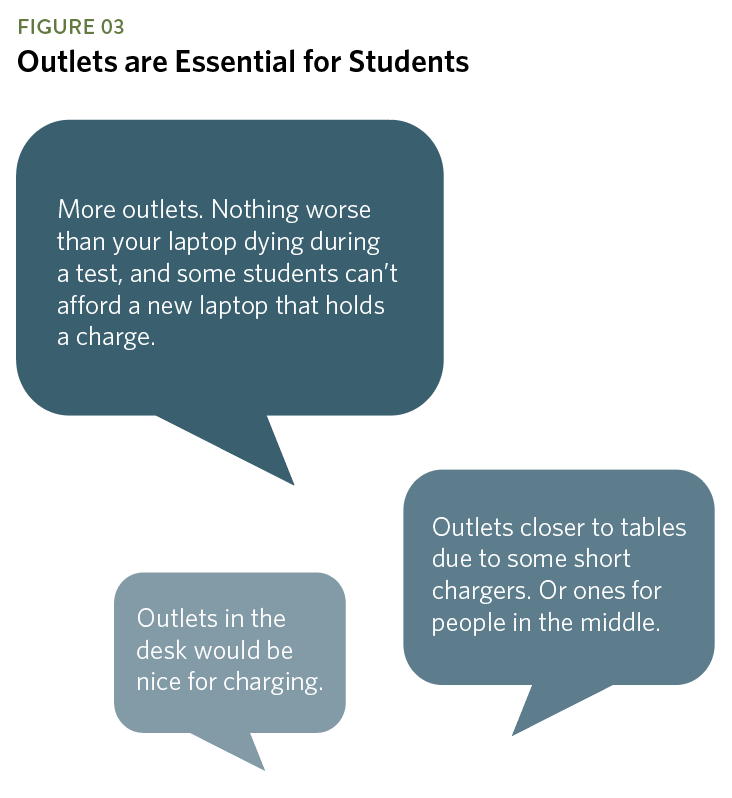
Analyzing the data collected from classroom pop-ins, usability studies, interviews, and surveys (partnering qualitative and quantitative data), DORIS found a significant difference in perceptions between the highest levels of leadership and students. You see, board members and administrators suggested solutions for student needs and experiences such as a quad between buildings and places for students to hang out. When talking to students about their needs, they relied heavily on the need for purposeful spaces for their time on campus, supporting study, food availability, andmore power outlets. Bridging this large gap brought important conversations to the leadership table.
Quantitative data visualization:

Qualitative data visualization:
The DORIS impact
Ultimately, DORIS partnered with the organization to streamline the data for their facilities and capital planning into one dynamic dashboard that updates as changes are made. This solution has brought the different stakeholders with different perspectives to one objective baseline; from there, capital asks are made. Extra Credit?! The dashboard has shown the inconsistencies in the data and supports behavioral change through more consistent reporting and updating.
I have high regard for DORIS and appreciate the chance to be their partner. DORIS helped us better understand, based on a rigorous, multi-step process, how an important space in our new building might be optimized. At first, I thought their job was to tell us where to put the furniture as I don’t have a design background. Instead, we talked about our goals for the space, we engaged stakeholders to assure that we had the right goals, and we talked about things like use patterns and the importance of adjacencies. In short, it was an educational process that helped us optimize the space. Since then, we worked with DORIS to perform an on-site observation of how that space is being used, research that can lead to additional recommendations. If you work with DORIS and their proprietary discovery process, you will never take space for granted again.
University Dean for a School of Business
Get the full report
Unlock the full redacted details of this case study. Fill out the form below and we will email you the full redacted insight report. Discover how our tailored solutions, guided by Human Ecology, can transform your world. Schedule a call with our experts to discuss your specific needs and start your journey with DORIS.
Stay updated with our latest insights. Subscribe to our newsletter today.

Copyright 2026 DORIS Research - Privacy Policy